Data Visualization
Visualize. Understand. Act. As businesses generate much data each day, effectively turning it into clear insights becomes mandatory.
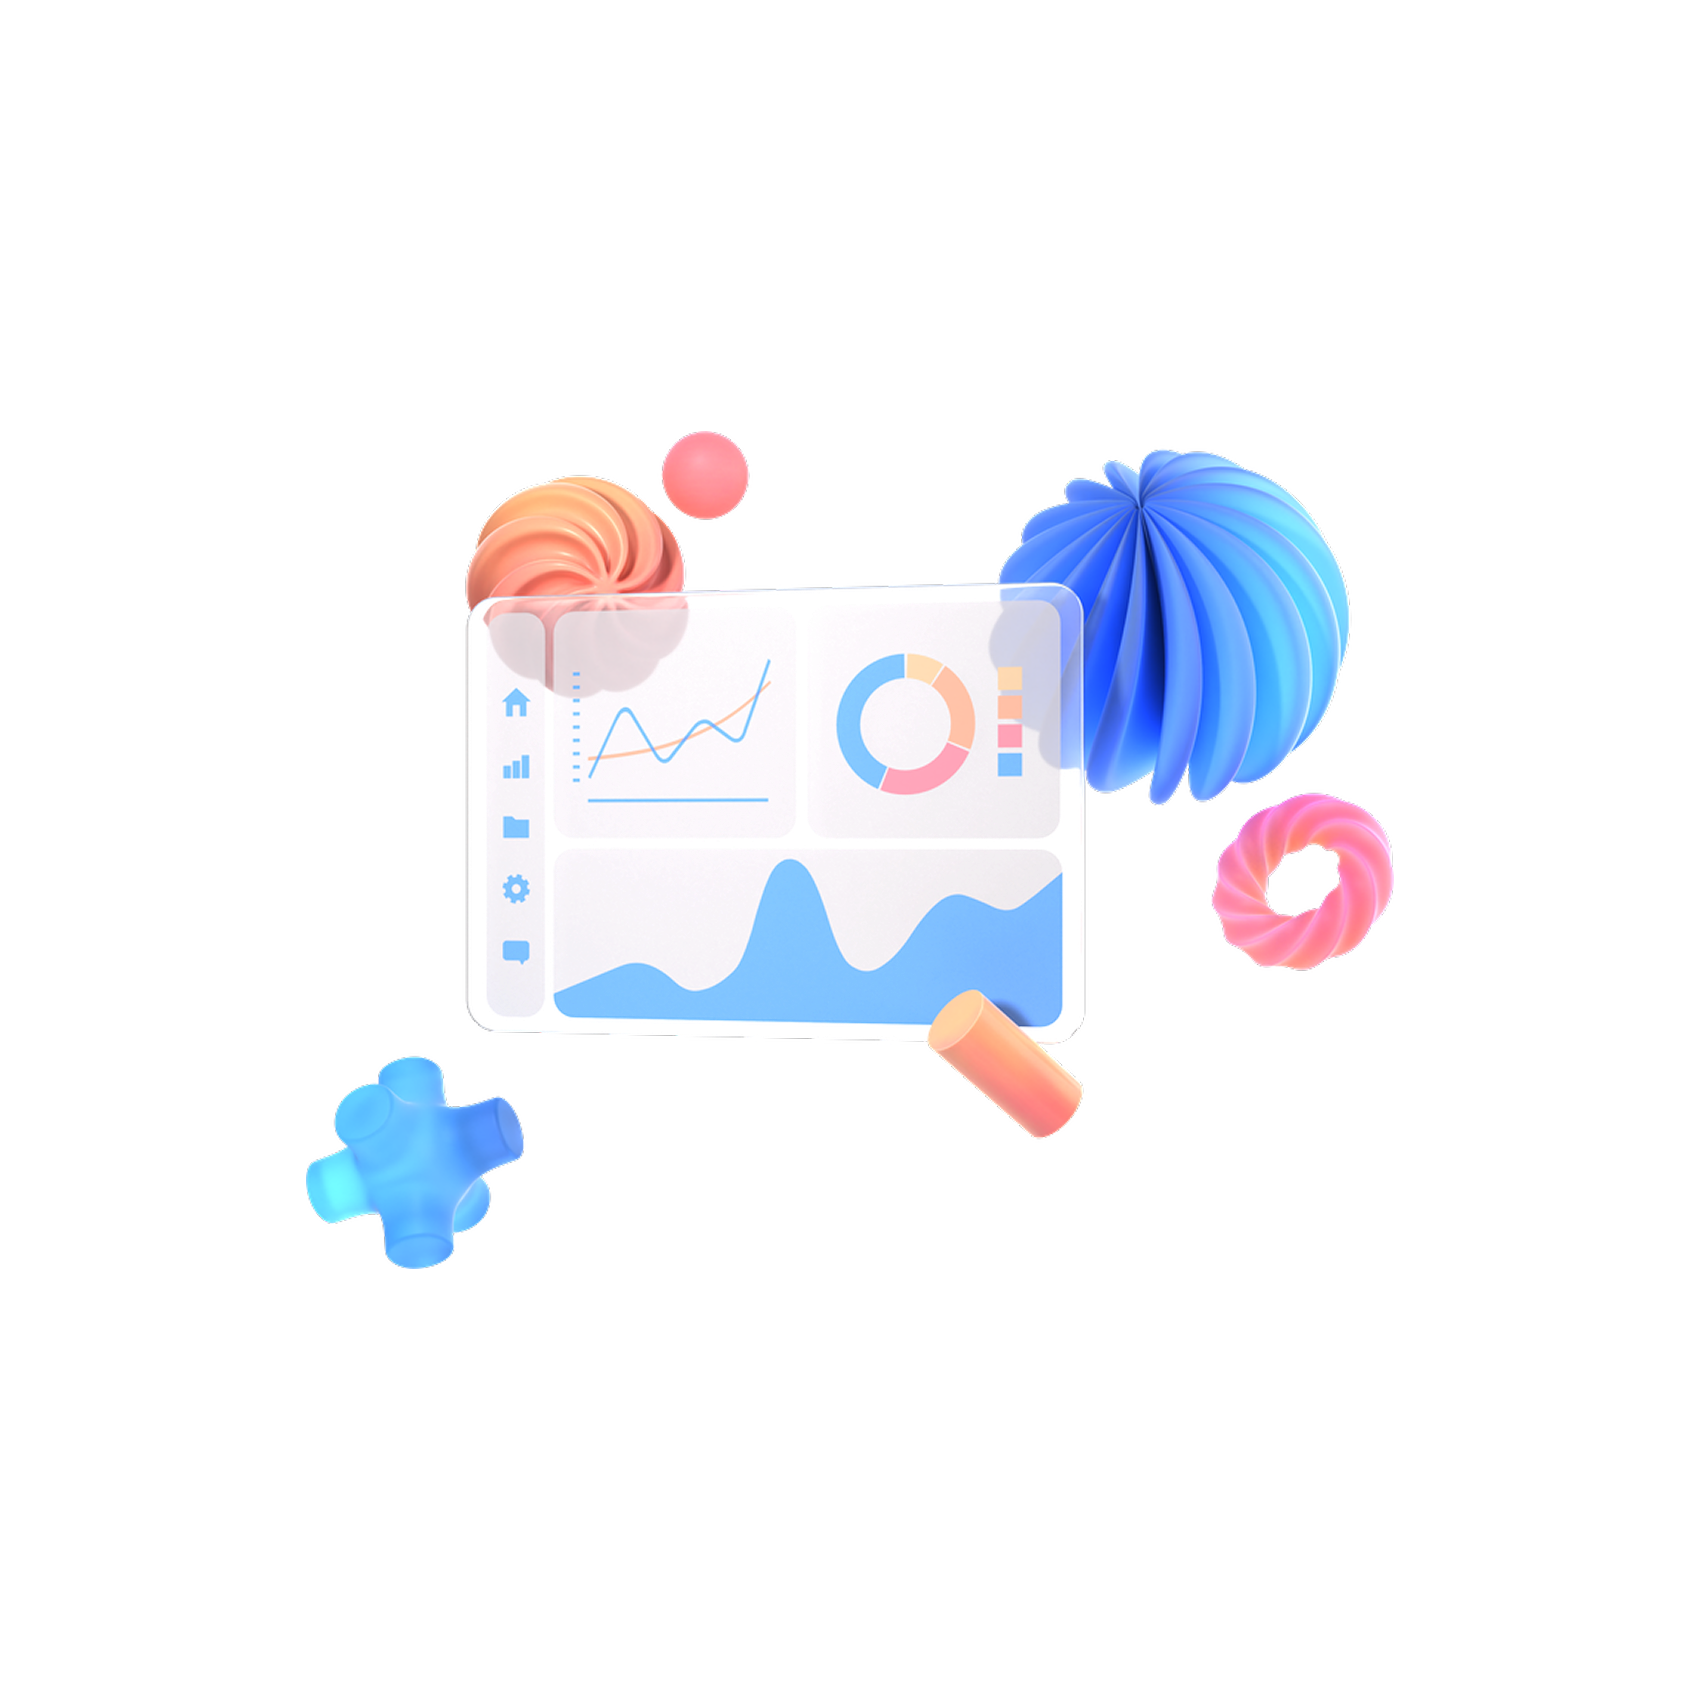
Visualize. Understand. Act
As businesses generate much data each day, effectively turning it into clear insights becomes mandatory, as they drive more informed and effective decisions. Data visualization transforms complex information into clear visuals to spot trends.
Nocture Solutions leads the way in data visualization through cutting-edge technology. We have stamped our position in the industry for delivering design and delivering dynamic dashboards and visual tools that convert data into simple, meaningful insights.
Our systems integrally meet your operational needs. It allows teams to understand data quickly, collaborate smoothly, and boost growth with informed choices.
Above all, your data remains dependable, well-structured, and insightful. Such adaptability adds value to your organization as you pursue a positive approach to plan wisely and perform with assurance. Remember, every decision becomes a step toward smarter success with clear insights and intelligent visuals.

What's Inside Our Data Visualization
Comprehensive data visualization solutions that transform complex data into clear, actionable insights through powerful visual tools.
Interactive Dashboards and Visual Reports
Dynamic, interactive dashboards that provide real-time insights and comprehensive visual reports for better decision-making.
Real-Time Insights Made Simple
Real-time data visualization that makes complex insights simple and accessible for quick understanding and action.
Works Smoothly with Your Tools
Seamless integration with your existing business tools and platforms for unified data visualization workflows.
Secure and Easy-to-Manage Solutions
Secure visualization platforms that are easy to manage and maintain, ensuring data protection and accessibility.
Timely Updates and Dependable Support
Regular updates and reliable support to ensure your visualization tools stay current and perform optimally.
Business-Focused Custom Visualisations
Tailored visualizations designed specifically for your business needs and operational requirements.
Data Storytelling and Visual Design
Compelling data storytelling through visual design that makes complex information engaging and understandable.
AI-Driven Forecasts and Trend Analysis
Advanced AI-powered forecasting and trend analysis visualized for predictive insights and strategic planning.
Frequently asked questions on
Data Visualization
Data visualization transforms complex information into clear visuals to spot trends, review performance, and identify areas for growth quickly. As businesses generate vast amounts of data daily, effectively turning it into clear insights becomes mandatory for driving informed and effective decisions. Visualization makes data accessible and actionable.
Yes, our data visualization solutions work smoothly with your existing tools and platforms. We provide seamless integration that allows teams to understand data quickly, collaborate smoothly, and boost growth with informed choices. Our systems integrally meet your operational needs while maintaining compatibility with your current infrastructure.
We create various types of visualizations including interactive dashboards, visual reports, custom business-focused visualizations, data storytelling designs, and AI-driven forecasts and trend analysis. From granular performance reports to comprehensive organizational overviews, our visualization platforms drive better outcomes through intelligent insights.
We provide secure and easy-to-manage solutions that ensure data protection and accessibility. Our visualization platforms maintain data security while making insights accessible. Above all, your data remains dependable, well-structured, and insightful, with security measures built into every visualization solution.
We provide timely updates and dependable support to ensure your visualization tools stay current and perform optimally. Our team helps you unlock the power of your data with higher growth and innovation. Together, we turn your information into meaningful actions that keep your business moving forward with clear insights and intelligent visuals.
Data Visualization Solutions Built for Every Industry
Finance
Financial dashboards, portfolio analytics, and investment performance visualization.
Business Analytics
Business intelligence dashboards, KPI tracking, and strategic insights visualization.
Marketing
Campaign analytics, ROI visualization, and customer engagement metrics dashboards.
Healthcare
Patient data visualization, clinical outcomes analytics, and healthcare dashboards.
Real Estate
Property analytics, market visualization, and investment portfolio dashboards.
E-commerce
Sales dashboards, customer behavior analytics, and e-commerce performance metrics.